
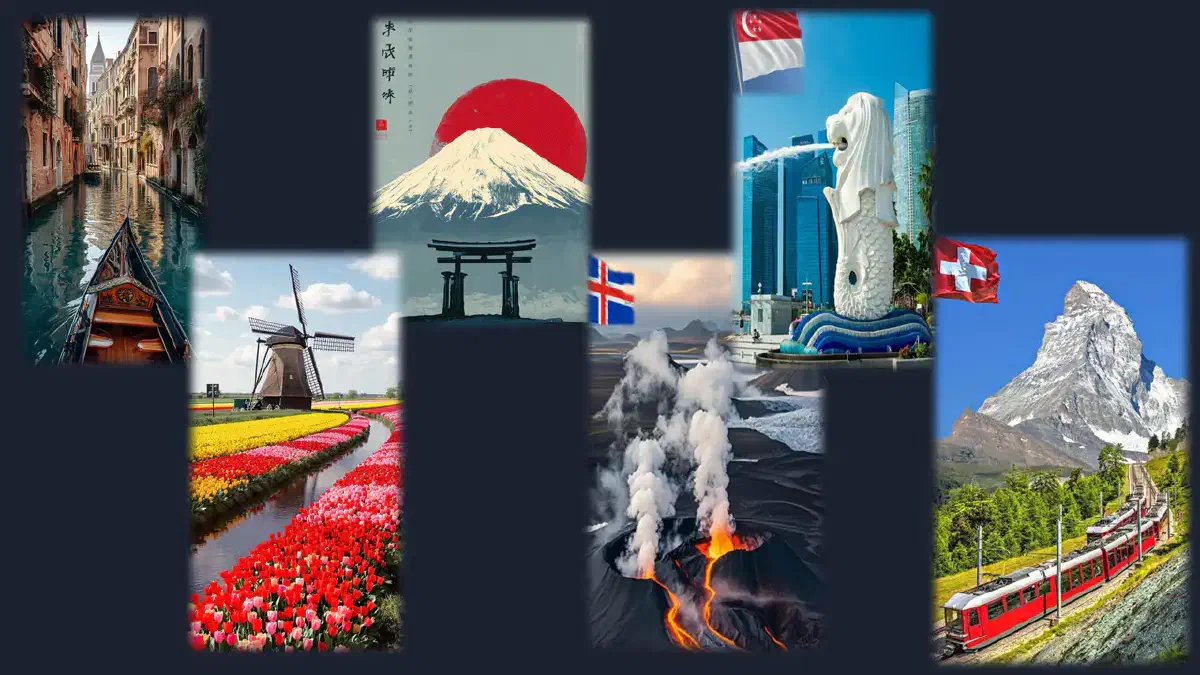
The Resilience Feedback Loop: Netherlands and Venice#
Start with the two most literal cases of "living with the enemy": water.
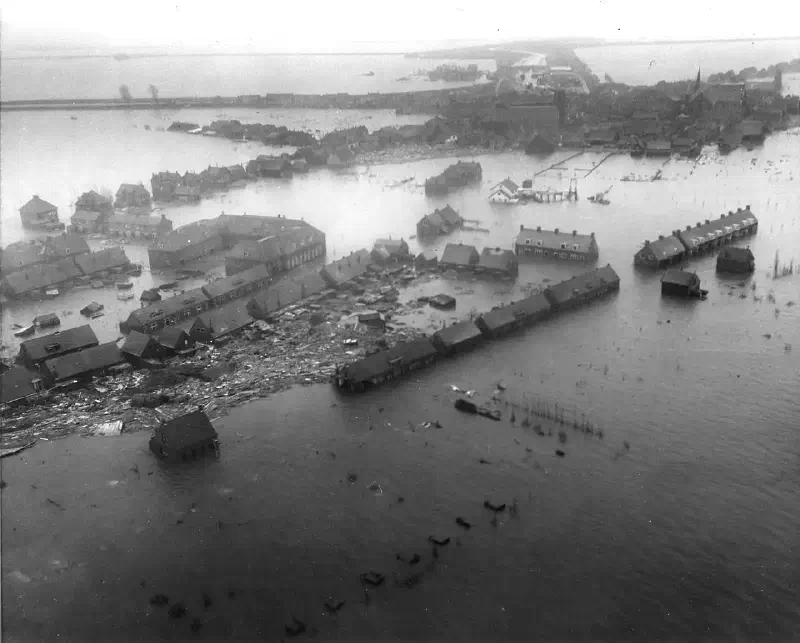
The Netherlands has 26% of its land below sea level and 60% flood‑prone (Ministry of Infrastructure and Water Management, 2022). The response was not a one‑off engineering fix but an evolving, self‑reinforcing system. In the 13th century, communities began forming waterschappen (water boards)—arguably the oldest democratic institutions in the country—to collectively build and maintain dykes. Success bred more fertile polder land, which raised agricultural output, which generated a surplus to invest in more sophisticated drainage. Today the Dutch agri‑food complex exports €137.5 billion annually, marking the tenth consecutive year of growth (CBS, 2026; Wageningen University & Research, 2026). The water‑management expertise itself remains a major export: the sector continues to generate €9.1 billion a year in goods and services abroad (Netherlands Enterprise Agency, 2022). The Delta Programme 2025 continues to drive innovation in flood risk management, freshwater availability and spatial adaptation (Delta Programme Commissioner, 2025). The reinforcing loop is at work: the threat of inundation → collective action → engineering prowess → economic surplus → reinvestment in protection and innovation. With a 2024 GDP per capita of $67,520 (World Bank, 2025) and an HDI of 0.946 (UNDP, 2022), the Netherlands remains a testament to centuries of systemic adaptation.
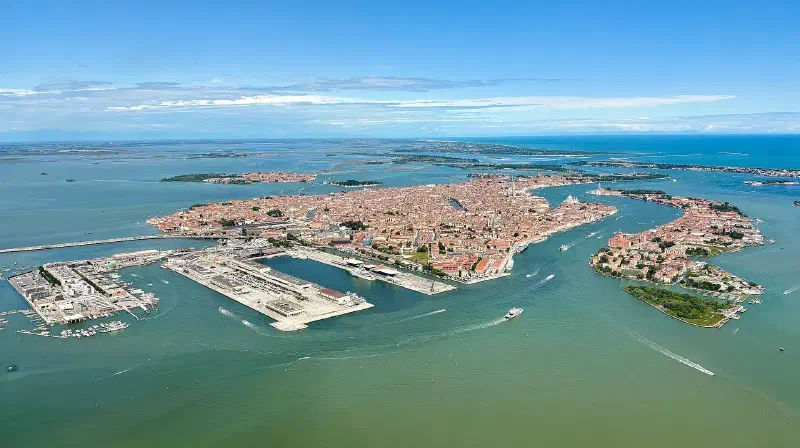
Venice, though a city, offers a historical parallel. Hemmed in by a brackish lagoon that offered neither fresh water nor arable land, the early Venetians turned to the sea for survival. The lagoon was a natural moat, but it also compelled the construction of a trading fleet. By the 15th century, Venice was the wealthiest city in Europe, with a per‑capita income of roughly 1,100 international dollars—on a par with the richest parts of the Low Countries (Bolt & van Zanden, 2024). The state‑owned Arsenal could turn out a fully‑equipped galley in a single day, an early example of industrial‑scale standardisation (Lane, 1973). Crucially, the Venetian elite designed institutions—such as the colleganza contract, a precursor of the joint‑stock company—that pooled risk and capital, allowing even modest merchants to participate in long‑distance trade. Environmental precarity thus spawned inclusive economic institutions, which then amplified the returns from the city’s maritime specialisation. The system held for half a millennium.
Resource Scarcity as a Spur to Human Capital: Singapore and Japan#
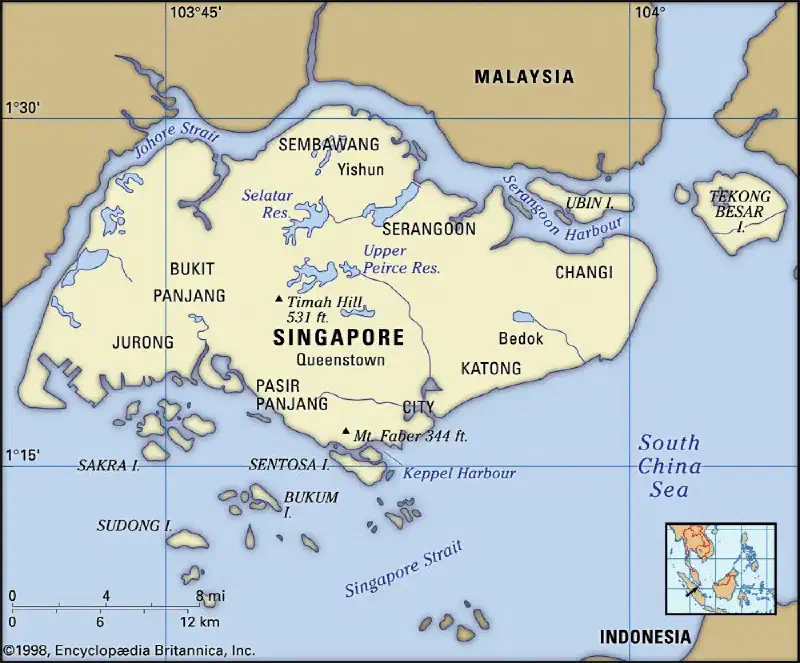
Singapore is a tiny island with no hinterland, no natural freshwater source large enough for its population, and, until recently, no domestic energy. Its post‑independence strategy treated this emptiness as a mandate for openness. A trade‑to‑GDP ratio of 337% (World Bank, 2022) reflects the deliberate choice to make the whole world its hinterland. Water security was tackled through a "Four Taps" strategy: local catchment, imported water, high‑grade recycled NEWater and desalination. Today, NEWater supplies 40% of national consumption (The City Paper Bogotá, 2025), and the country aims for complete self‑sufficiency by 2060, up from a previous target of 2061 (The City Paper Bogotá, 2025; LinkedIn, 2025). The technological drive required to solve water scarcity has spun off a global water‑industry cluster. Singapore’s 2025 GDP per capita stands at $85,412 (IMF, 2025), and its HDI is 0.946 (UNDP, 2025). The systemic logic is striking: zero natural endowment → forced investment in human capital and governance → business‑friendly, meritocratic institutions → attraction of foreign capital → wealth to fund further technological leapfrogging.
Japan’s scarcity is spatial and geological. Over 73% of the archipelago is mountainous forest, leaving only 11.1% of land as arable (World Bank, 2023). Earthquakes, tsunamis and typhoons are routine. Rather than remain at nature’s mercy, Japan developed the world’s most advanced seismic‑resistant construction and disaster‑early‑warning systems, with the Building Standard Law of 1981 acting as a pivotal game‑changer (Times of India, 2025). The Shinkansen bullet train, built to compress a mountainous country into a single economic space, now moves over 1 million passengers a day with a near‑perfect safety record (Government of Japan, n.d.). Manufacturing evolved a cult of efficiency—the Toyota Production System (TPS) —to eliminate waste when every input had to be imported, and TPS continues to evolve into the digital age (Toyota, 2025). Japan ranks third globally for international patent applications, with 47,922 filed through WIPO in 2025 (WIPO, 2026), and has a GDP per capita of $34,412 (World Economics, 2025), all sustained on a razor’s edge of resource dependence. The system again exhibits a balancing feedback: a shock (earthquake, oil crisis) tightens the societal resolve to improve efficiency and resilience, which builds a competitive edge that generates surpluses, which are then reinvested in protection and advanced technology.
Monetising Adversity: Switzerland and Iceland#
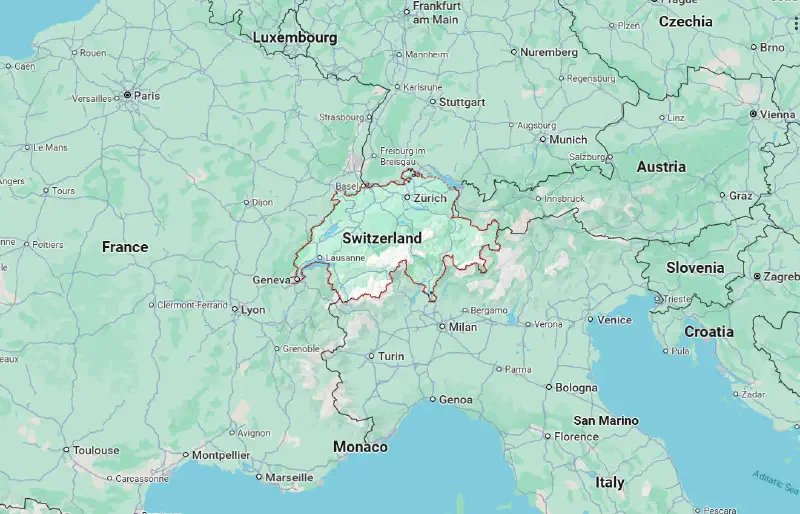
Switzerland is landlocked, alpine and devoid of fossil fuels. Its response was to specialise in weightless, high‑value activities that bypass physical geography: pharmaceuticals, precision instruments, financial services and, increasingly, intellectual property. The country has topped the Global Innovation Index for the 15th consecutive year, a position it has held since 2011 (WIPO, 2025; KMU.admin.ch, 2025). Its mountains, once a trade barrier, were turned into an asset through world‑leading tunnel engineering (the Gotthard Base Tunnel is the world’s longest rail tunnel) and hydropower, which supplies 58.5% of domestic electricity (Swiss Federal Office of Energy, 2026). 2025 GDP per capita is $101,128 (World Economics, 2025), among the highest on the planet. The Swiss system exploits a positive feedback loop between political stability—built on centuries of neutrality and direct democracy—and the ability to attract mobile capital and talent, which in turn demands the education and infrastructure that reinforce stability.
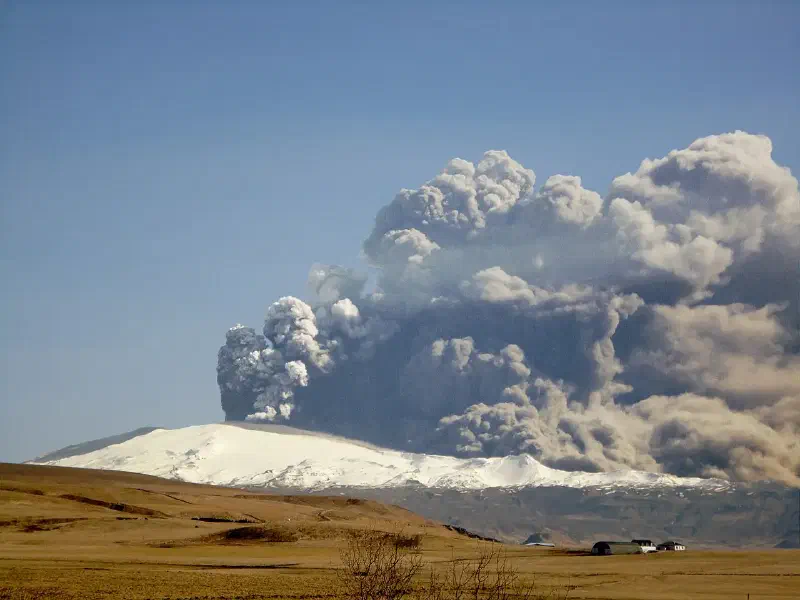
Iceland endures a raw North Atlantic climate, regular volcanic eruptions and centuries of isolation. Yet it has converted its geology into a near‑100% renewable energy system. Geothermal and hydropower provide 85% of primary energy, heating nine out of ten homes and powering energy‑intensive industries such as aluminium smelting and data centres (Orkustofnun, 2023). The surrounding seas, managed through a science‑based individual transferable quota (ITQ) system since the 1980s, sustain a fishery that accounts for 41% of goods exports (Statistics Iceland, 2022). The total export value of seafood reached approximately ISK 359 billion (USD 2.87 billion) in 2025 (WeAreAquaculture, 2026). The result is a GDP per capita of $79,818 (World Economics, 2025) and an HDI of 0.972, ranking first globally (UNDP, 2025). Iceland’s trajectory illustrates a classic adaptive cycle: a fragile resource base forced collective management of fisheries and energy, which built the institutional capacity to exploit a niche (renewable energy and sustainable protein) that is now in surging global demand.
The Common System Architecture#
Across these six cases, a recurring pattern is visible. Environmental vulnerability, if it does not overwhelm the society immediately, acts as a trigger for three interlocked developments:
Inclusive and anticipatory institutions. From the Dutch water boards to Venice's commercial law, Singapore's Public Utilities Board, Japan's building standards, Swiss federalism and Iceland's fisheries management, each place created governance structures that forced collective action and long‑term planning. The rule‑of‑law percentile scores tell the modern story: Netherlands (96.3), Singapore (97.6), Switzerland (99.0), Japan (92.3) and Iceland (96.1)—all in the highest tier of the Worldwide Governance Indicators (World Bank, 2023).
Human and knowledge capital as the ultimate resource. Denied easy rents, these societies invested heavily in education, innovation and the export of expertise. Singapore's water technology, Dutch delta engineering, Swiss precision manufacturing, Japanese disaster‑prevention systems and Icelandic geothermal consultancy are all direct exports of solutions originally developed for domestic survival.
Reinforcing feedback that turns niches into economic moats. Success in a specialised field attracts global demand, which deepens the skill base, which attracts more demand. The Netherlands' water sector, for instance, is a €9.1 billion export industry because centuries of domestic necessity created an unrivalled knowledge cluster. Iceland's renewable‑energy expertise now attracts power‑hungry Bitcoin miners and aluminium smelters, creating a virtuous circle.
There is also a balancing feedback at work: prosperity does not lead to complacency. The Dutch Delta Programme is legally mandated to review flood defences annually (Delta Programme Commissioner, 2025). Singapore regularly revises its water‑security roadmap. Japan's building codes are tightened after every major seismic event. The memory of disaster is institutionalised.
Conclusion#
None of these places enjoyed an easy start. Environmental determinism would have predicted marginality or collapse. Instead, they became prototypes of the "antifragile"—systems that gain strength from shocks. For a world entering an era of climate disruption, their deepest lesson is not a specific technology but a systems logic: when a society's survival depends on collective ingenuity, it builds institutions capable of turning its greatest liability into its most durable source of wealth.
References#
- Bolt, J., & van Zanden, J. L. (2024). Maddison‐style estimates of the evolution of the world economy: A new 2023 update. Journal of Economic Surveys, 39(2), 631-671.
- CBS (Statistics Netherlands). (2026, January 16). Value of agricultural exports up by over 8 percent in 2025. https://www.cbs.nl/
- Delta Programme Commissioner. (2025). Delta Programme 2025. https://english.deltaprogramma.nl/
- Government of Japan. (n.d.). The Shinkansen: Japan's High-Speed Rail Is Full of Miracles. JapanGov. https://www.japan.go.jp/
- IMF (International Monetary Fund). (2025, April 22). Report for Selected Countries and Subjects: Singapore. https://www.imf.org/
- KMU.admin.ch (State Secretariat for Economic Affairs). (2025, August 10). Switzerland remains the world's most innovative country. https://www.kmu.admin.ch/
- Lane, F. C. (1973). Venice, a maritime republic. Johns Hopkins University Press.
- LinkedIn. (2025, June 10). Singapore uses less water per person today than the country did in 2003... [Post]. https://www.linkedin.com/
- Ministry of Infrastructure and Water Management. (2022). Factsheet: Flood risk management in the Netherlands. Government of the Netherlands.
- Netherlands Enterprise Agency. (2022). Water sector facts & figures 2022. Government of the Netherlands.
- Orkustofnun (National Energy Authority of Iceland). (2023). Primary Energy Use in Iceland 1940–2022. https://orkustofnun.is/
- Statistics Iceland. (2022). Exports of goods and services 2021. https://www.statice.is/
- Swiss Federal Office of Energy. (2026, April 5). Force hydraulique en Suisse: statistique 2025. https://www.admin.ch/
- The City Paper Bogotá. (2025, June 13). How Singapore Turned Necessity into Sustainability and Global Influence. https://thecitypaperbogota.com/
- Times of India. (2025, July 30). 8.8-magnitude earthquake exposes global risk: Here's how Japan's buildings use shock tech... https://toivideos.timesofindia.indiatimes.com/
- Toyota. (2025, July 16). Toyota Takes its Legendary Lean Manufacturing System into the Digital Age. Automotive Manufacturing Solutions. https://www.automotivemanufacturingsolutions.com/
- UNDP (United Nations Development Programme). (2022). Human Development Report 2021/22: Uncertain times, unsettled lives: Shaping our future in a transforming world. https://hdr.undp.org/
- UNDP. (2025). Human Development Report 2025: Breaking the Gridlock: Reimagining Cooperation in a Polarized World. https://hdr.undp.org/
- Wageningen University & Research. (2026, January 16). Agricultural exports continue to grow, imports grow faster. https://www.wur.nl/
- WeAreAquaculture. (2026, March 6). Icelandic seafood exports value increased by around 4% in 2025. https://weareaquaculture.com/
- WIPO (World Intellectual Property Organization). (2025). Global Innovation Index 2025: Innovation in the face of uncertainty. https://www.wipo.int/
- WIPO. (2026, March 7). 2025 sees strong growth in international patent applications. https://www.china.org.cn/
- World Bank. (2022). Trade (% of GDP) - Singapore. World Bank Data. https://data.worldbank.org/
- World Bank. (2023). World Development Indicators. https://databank.worldbank.org/
- World Bank. (2023). Worldwide Governance Indicators. https://info.worldbank.org/governance/wgi/
- World Bank. (2025). GDP per capita (current US$) - Netherlands. https://data.worldbank.org/
- World Economics. (2025). GDP per Capita (Current / Nominal) - Switzerland. https://www.worldeconomics.com/
- World Economics. (2025). GDP per Capita (Current / Nominal) - Japan. https://www.worldeconomics.com/
- World Economics. (2025). GDP per Capita (Current / Nominal) - Iceland. https://www.worldeconomics.com/